Talk like a graph: Encoding graphs for large language models
March 12, 2024
Bahare Fatemi, Research Scientist, Google Research, and Bryan Perozzi, Research Scientist, Google Research
We dug deep into how to best represent graphs as text so LLMs can understand them — our investigation found three major factors that affect the results.
Quick links
Imagine all the things around you — your friends, tools in your kitchen, or even the parts of your bike. They are all connected in different ways. In computer science, the term graph is used to describe connections between objects. Graphs consist of nodes (the objects themselves) and edges (connections between two nodes, indicating a relationship between them). Graphs are everywhere now. The internet itself is a giant graph of websites linked together. Even the knowledge search engines use is organized in a graph-like way.
Furthermore, consider the remarkable advancements in artificial intelligence — such as chatbots that can write stories in seconds, and even software that can interpret medical reports. This exciting progress is largely thanks to large language models (LLMs). New LLM technology is constantly being developed for different uses.
Since graphs are everywhere and LLM technology is on the rise, in “Talk like a Graph: Encoding Graphs for Large Language Models”, presented at ICLR 2024, we present a way to teach powerful LLMs how to better reason with graph information. Graphs are a useful way to organize information, but LLMs are mostly trained on regular text. The objective is to test different techniques to see what works best and gain practical insights. Translating graphs into text that LLMs can understand is a remarkably complex task. The difficulty stems from the inherent complexity of graph structures with multiple nodes and the intricate web of edges that connect them. Our work studies how to take a graph and translate it into a format that an LLM can understand. We also design a benchmark called GraphQA to study different approaches on different graph reasoning problems and show how to phrase a graph-related problem in a way that enables the LLM to solve the graph problem. We show that LLM performance on graph reasoning tasks varies on three fundamental levels: 1) the graph encoding method, 2) the nature of the graph task itself, and 3) interestingly, the very structure of the graph considered. These findings give us clues on how to best represent graphs for LLMs. Picking the right method can make the LLM up to 60% better at graph tasks!

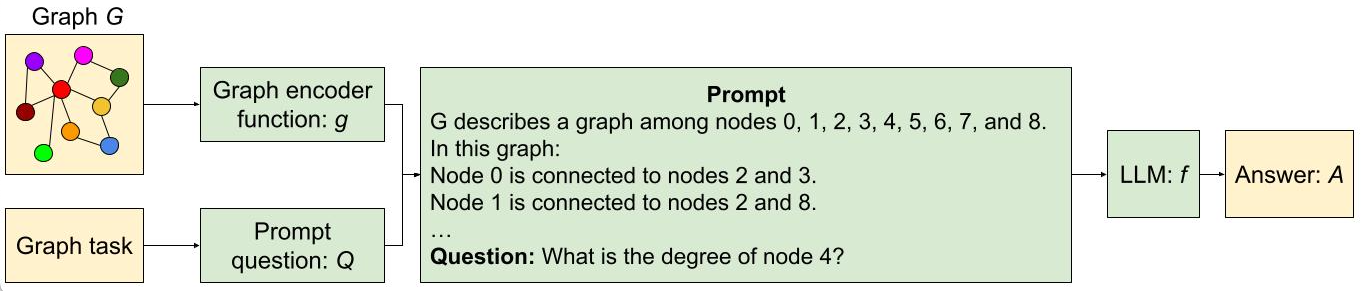
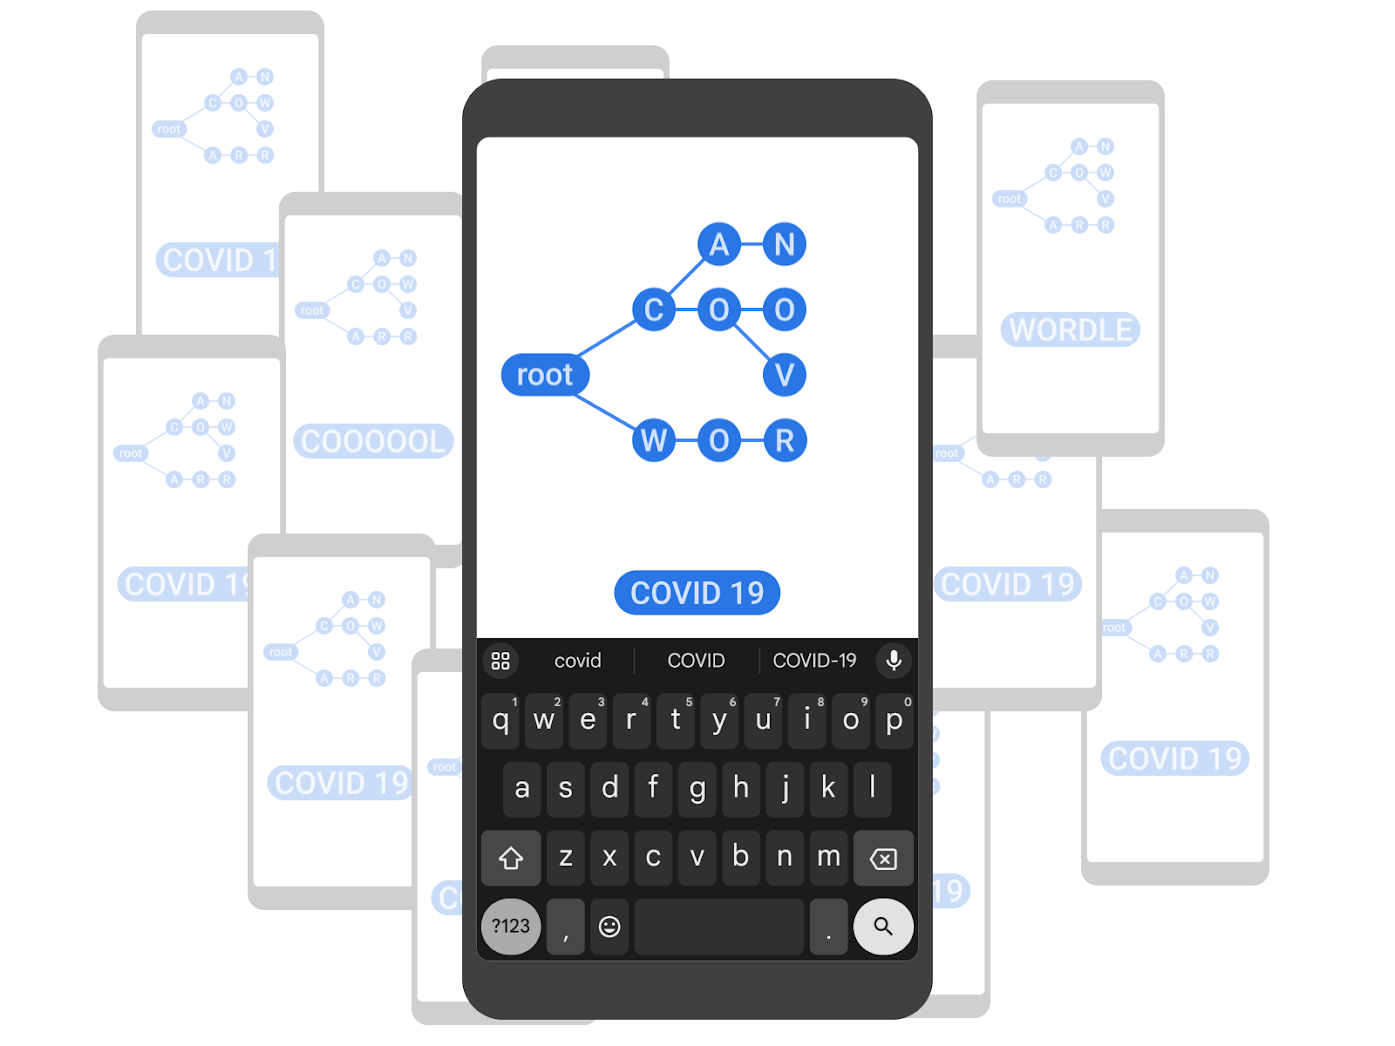
Pictured, the process of encoding a graph as text using two different approaches and feeding the text and a question about the graph to the LLM.
Graphs as text
To be able to systematically find out what is the best way to translate a graph to text, we first design a benchmark called GraphQA. Think of GraphQA as an exam designed to evaluate powerful LLMs on graph-specific problems. We want to see how well LLMs can understand and solve problems that involve graphs in different setups. To create a comprehensive and realistic exam for LLMs, we don’t just use one type of graph, we use a mix of graphs ensuring breadth in the number of connections. This is mainly because different graph types make solving such problems easier or harder. This way, GraphQA can help expose biases in how an LLM thinks about the graphs, and the whole exam gets closer to a realistic setup that LLMs might encounter in the real world.
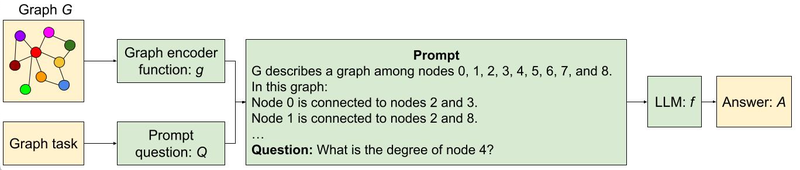
Overview of our framework for reasoning with graphs using LLMs.
GraphQA focuses on simple tasks related to graphs, like checking if an edge exists, calculating the number of nodes or edges, finding nodes that are connected to a specific node, and checking for cycles in a graph. These tasks might seem basic, but they require understanding the relationships between nodes and edges. By covering different types of challenges, from identifying patterns to creating new connections, GraphQA helps models learn how to analyze graphs effectively. These basic tasks are crucial for more complex reasoning on graphs, like finding the shortest path between nodes, detecting communities, or identifying influential nodes. Additionally, GraphQA includes generating random graphs using various algorithms like Erdős-Rényi, scale-free networks, Barabasi-Albert model, and stochastic block model, as well as simpler graph structures like paths, complete graphs, and star graphs, providing a diverse set of data for training.
When working with graphs, we also need to find ways to ask graph-related questions that LLMs can understand. Prompting heuristics are different strategies for doing this. Let's break down the common ones:
- Zero-shot: simply describe the task ("Is there a cycle in this graph?") and tell the LLM to go for it. No examples provided.
- Few-shot: This is like giving the LLM a mini practice test before the real deal. We provide a few example graph questions and their correct answers.
- Chain-of-Thought: Here, we show the LLM how to break down a problem step-by-step with examples. The goal is to teach it to generate its own "thought process" when faced with new graphs.
- Zero-CoT: Similar to CoT, but instead of training examples, we give the LLM a simple prompt, like "Let's think step-by-step," to trigger its own problem-solving breakdown.
- BAG (build a graph): This is specifically for graph tasks. We add the phrase "Let's build a graph..." to the description, helping the LLM focus on the graph structure.
We explored different ways to translate graphs into text that LLMs can work with. Our key questions were:
- Node encoding: How do we represent individual nodes? Options tested include simple integers, common names (people, characters), and letters.
- Edge encoding: How do we describe the relationships between nodes? Methods involved parenthesis notation, phrases like "are friends", and symbolic representations like arrows.
Various node and edge encodings were combined systematically. This led to functions like the ones in the following figure:
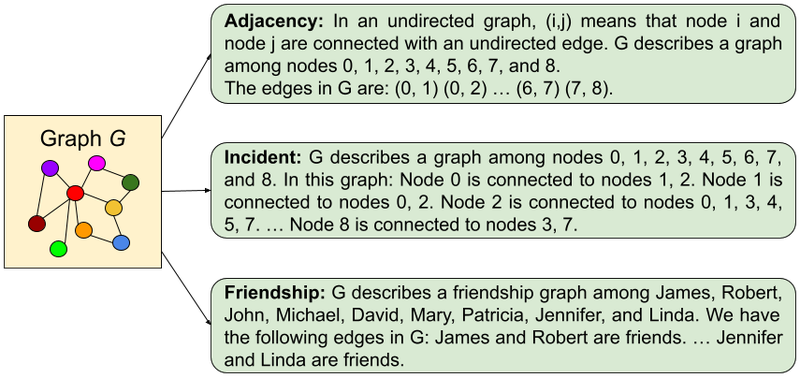
Examples of graph encoding functions used to encode graphs via text.
Analysis and results
We carried out three key experiments: one to test how LLMs handle graph tasks, and two to understand how the size of the LLM and different graph shapes affected performance. We run all our experiments on GraphQA.
How LLMs handle graph tasks
In this experiment, we tested how well pre-trained LLMs tackle graph problems like identifying connections, cycles, and node degrees. Here is what we learned:
- LLMs struggle: On most of these basic tasks, LLMs did not do much better than a random guess.
- Encoding matters significantly: How we represent the graph as text has a great effect on LLM performance. The "incident" encoding excelled for most of the tasks in general.
Our results are summarized in the following chart.
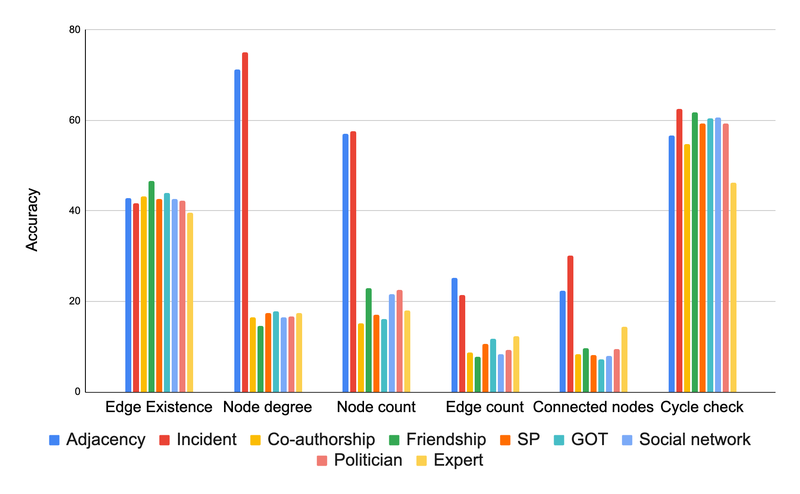
Comparison of various graph encoder functions based on their accuracy on different graph tasks. The main conclusion from this figure is that the graph encoding functions matter significantly.
Bigger is (usually) better
In this experiment, we wanted to see if the size of the LLM (in terms of the number of parameters) affects how well they can handle graph problems. For that, we tested the same graph tasks on the XXS, XS, S, and L sizes of PaLM 2. Here is a summary of our findings:
- In general, bigger models did better on graph reasoning tasks. It seems like the extra parameters gave them space to learn more complex patterns.
- Oddly, size didn't matter as much for the “edge existence” task (finding out if two nodes in a graph are connected).
- Even the biggest LLM couldn't consistently beat a simple baseline solution on the cycle check problem (finding out if a graph contains a cycle or not). This shows LLMs still have room to improve with certain graph tasks.
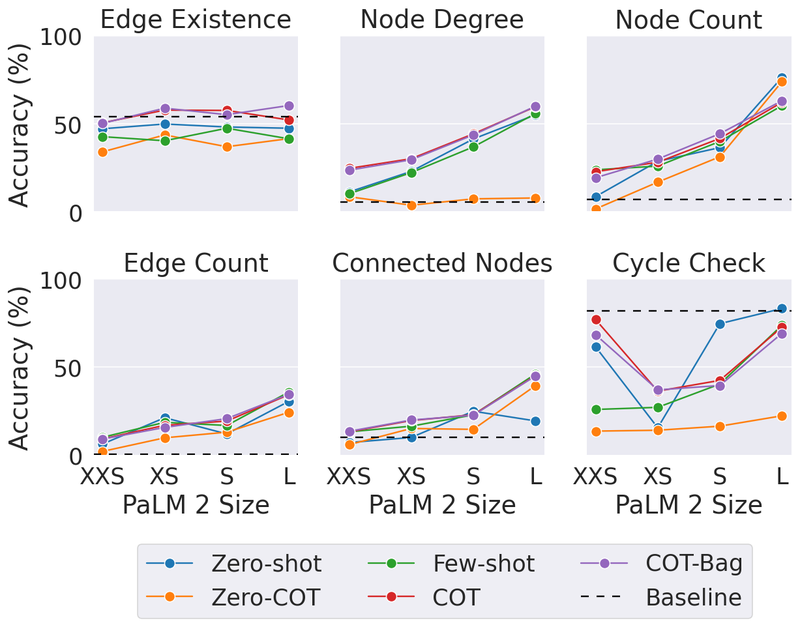
Effect of Model Capacity on graph reasoning task for PaLM 2-XXS, XS, S, and L.
Do different graph shapes confuse LLMs
We wondered if the "shape" of a graph (how nodes are connected) influences how well LLMs can solve problems on it. Think of the following figure as different examples of graph shapes.
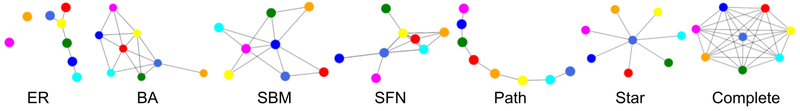
Samples of graphs generated with different graph generators from GraphQA. ER, BA, SBM, and SFN refers to Erdős–Rényi, Barabási–Albert, Stochastic Block Model, and Scale-Free Network respectively.
We found that graph structure has a big impact on LLM performance. For example, in a task asking if a cycle exists, LLMs did great on tightly interconnected graphs (cycles are common there) but struggled on path graphs (where cycles never happen). Interestingly, providing some mixed examples helped it adapt. For instance, for cycle check, we added some examples containing a cycle and some examples with no cycles as few-shot examples in our prompt. Similar patterns occurred with other tasks.
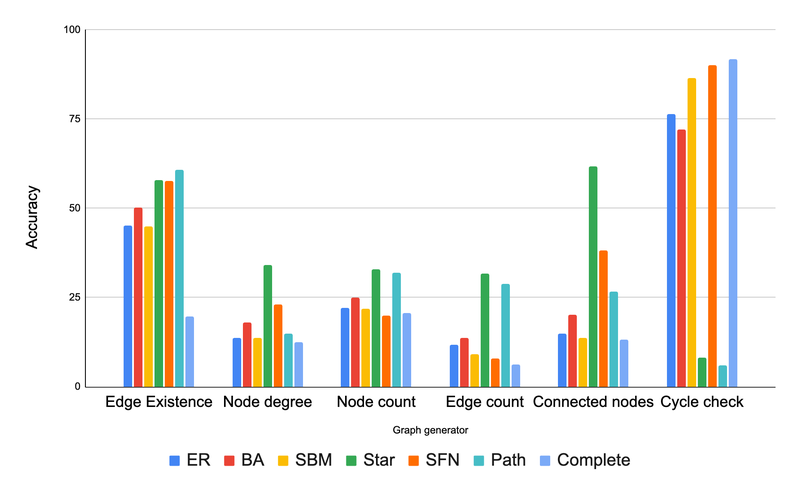
Comparing different graph generators on different graph tasks. The main observation here is that graph structure has a significant impact on the LLM’s performance. ER, BA, SBM, and SFN refers to Erdős–Rényi, Barabási–Albert, Stochastic Block Model, and Scale-Free Network respectively.
Conclusion
In short, we dug deep into how to best represent graphs as text so LLMs can understand them. We found three major factors that make a difference:
- How to translate the graph to text: how we represent the graph as text significantly influences LLM performance. The incident encoding excelled for most of the tasks in general..
- Task type: Certain types of graph questions tend to be harder for LLMs, even with a good translation from graph to text.
- Graph structure: Surprisingly, the "shape" of the graph that on which we do inference (dense with connections, sparse, etc.) influences how well an LLM does.
This study revealed key insights about how to prepare graphs for LLMs. The right encoding techniques can significantly boost an LLM's accuracy on graph problems (ranging from around 5% to over 60% improvement). Our new benchmark, GraphQA, will help drive further research in this area.
Acknowledgements
We would like to express our gratitude to our co-author, Jonathan Halcrow, for his valuable contributions to this work. We express our sincere gratitude to Anton Tsitsulin, Dustin Zelle, Silvio Lattanzi, Vahab Mirrokni, and the entire graph mining team at Google Research, for their insightful comments, thorough proofreading, and constructive feedback which greatly enhanced the quality of our work. We would also like to extend special thanks to Tom Small for creating the animation used in this post.
Quick links
Other posts of interest
-
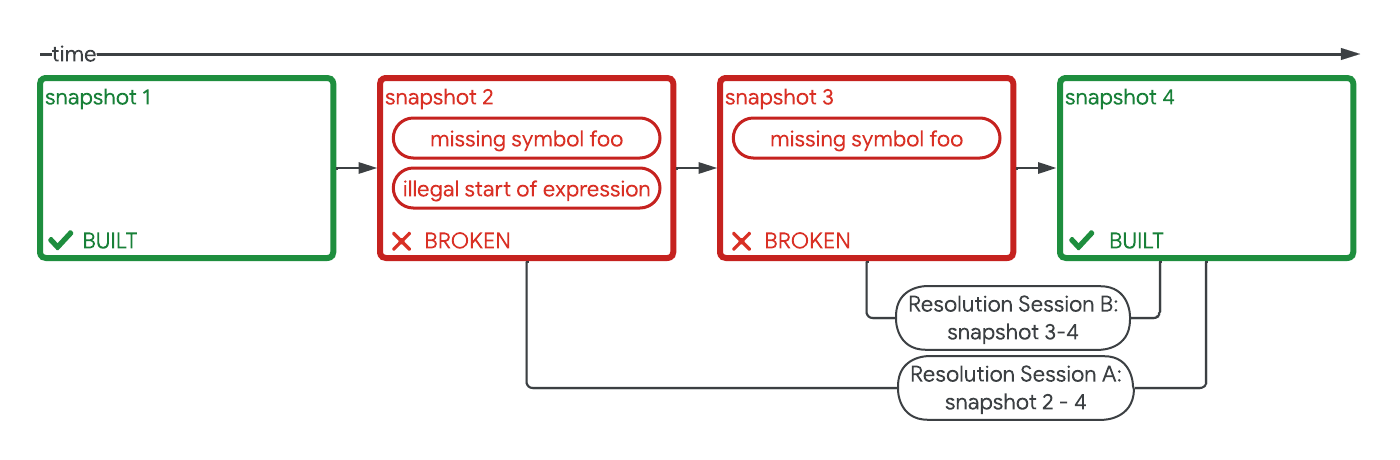
April 23, 2024
Safely repairing broken builds with ML- Machine Intelligence ·
- Software Systems & Engineering
-
April 19, 2024
Improving Gboard language models via private federated analytics- Algorithms & Theory ·
- Distributed Systems & Parallel Computing ·
- Product ·
- Security, Privacy and Abuse Prevention
-

April 16, 2024
Solving the minimum cut problem for undirected graphs- Algorithms & Theory