
Enabling large-scale health studies for the research community
November 10, 2023
Posted by Chintan Ghate, Software Engineer, and Diana Mincu, Research Engineer, Google Research
Quick links

As consumer technologies like fitness trackers and mobile phones become more widely used for health-related data collection, so does the opportunity to leverage these data pathways to study and advance our understanding of medical conditions. We have previously touched upon how our work explores the use of this technology within the context of chronic diseases, in particular multiple sclerosis (MS). This effort leverages the FDA MyStudies platform, an open-source platform used to create clinical study apps, that makes it easier for anyone to run their own studies and collect good quality healthcare data, in a trusted and safe way.
Today, we describe the setup that we developed by expanding the FDA MyStudies platform and demonstrate how it can be used to set up a digital health study. We also present our exploratory research study created through this platform, called MS Signals, which consists of a symptom tracking app for MS patients. The goal for this app is twofold: 1) to ensure that the enhancements to the FDA MyStudies platform made for a more streamlined study creation experience; and 2) to understand how new data collection mechanisms can be used to revolutionize patients’ chronic disease management and tracking. We have open sourced our extension to the FDA MyStudies platform under the Apache 2.0 license to provide a resource for the community to build their own studies.
Extending the FDA MyStudies platform
The original FDA MyStudies platform allowed people to configure their own study apps, manage participants, and create separate iOS and Android apps. To simplify the study creation process and ensure increased study engagement, we made a number of accessibility changes. Some of the main improvements include: cross-platform (iOS and Android) app generation through the use of Flutter, an open source framework by Google for building multi-platform applications from a single codebase; a simplified setup, so that users can prototype their study quickly (under a day in most cases); and, most importantly, an emphasis on accessibility so that diverse patient’s voices are heard. The accessibility enhancements include changes to the underlying features of the platform and to the particular study design of the MS Signals study app.
Multi-platform support with rapid prototyping
We decided on the use of Flutter as it would be a single point that would generate both iOS and Android apps in one go, reducing the work required to support multiple platforms. Flutter also provides hot-reloading, which allows developers to build & preview features quickly. The design-system in the app takes advantage of this feature to provide a central point from which the branding & theme of the app can be changed to match the tone of a new study and previewed instantly. The demo environment in the app also utilizes this feature to allow developers to mock and preview questionnaires locally on their machines. In our experience this has been a huge time-saver in A/B testing the UX and the format and wording of questions live with clinicians.
System accessibility enhancements
To improve the accessibility of the platform for more users, we made several usability enhancements:
- Light & dark theme support
- Bold text & variable font-sizes
- High-contrast mode
- Improving user awareness of accessibility settings
Extended exposure to bright light themes can strain the eyes, so supporting dark theme features was necessary to make it easier to use the study app frequently. Some small or light text-elements are illegible to users with vision impairments, so we added 1) bold-text and support for larger font-sizes and 2) high-contrast color-schemes. To ensure that accessibility settings are easy to find, we placed an introductory one-time screen that was presented during the app’s first launch, which would directly take users to their system accessibility settings.
Study accessibility enhancements
To make the study itself easier to interact with and reduce cognitive overload, we made the following changes:
- Clarified the onboarding process
- Improved design for questionnaires
First, we clarified the on-boarding process by presenting users with a list of required steps when they first open the app in order to reduce confusion and participant drop-off.
The original questionnaire design in the app presented each question in a card format, which utilizes part of the screen for shadows and depth effects of the card. In many situations, this is a pleasant aesthetic, but in apps where accessibility is priority, these visual elements restrict the space available on the screen. Thus, when more accessible, larger font-sizes are used there are more frequent word breaks, which reduces readability. We fixed this simply by removing the card design elements and instead using the entire screen, allowing for better visuals with larger font-sizes.
The MS Signals prototype study
To test the usability of these changes, we used our redesigned platform to create a prototype study app called MS Signals, which uses surveys to gather information about a participant’s MS-related symptoms.
 |
| MS Signals app screenshots. |
MS Studies app design
As a first step, before entering any study information, participants are asked to complete an eligibility and study comprehension questionnaire to ensure that they have read through the potentially lengthy terms of study participation. This might include, for example, questions like "In what country is the study available?" or “Can you withdraw from the study?" A section like this is common in most health studies, and it tends to be the first drop-off point for participants.
To minimize study drop-off at this early stage, we kept the eligibility test brief and reflected correct answers for the comprehension test back to the participants. This helps minimize the number of times a user may need to go through the initial eligibility questionnaire and ensures that the important aspects of the study protocol are made clear to them.
After successful enrollment, participants are taken to the main app view, which consists of three pages:
- Activities:
This page lists the questionnaires available to the participant and is where the majority of their time is spent. The questionnaires vary in frequency — some are one-time surveys created to gather medical history, while others are repeated daily, weekly or monthly, depending on the symptom or area they are exploring. For the one-time survey we provide a counter above each question to signal to users how far they have come and how many questions are left, similar to the questionnaire during the eligibility and comprehension step. - Dashboard:
To ensure that participants get something back in return for the information they enter during a study, the Dashboard area presents a summary of their responses in graph or pie chart form. Participants could potentially show this data to their care provider as a summary of their condition over the last 6 months, an improvement over the traditional pen and paper methods that many employ today. - Resources:
A set of useful links, help articles and common questions related to MS.
Questionnaire design
Since needing to frequently input data can lead to cognitive overload, participant drop off, and bad data quality, we reduced the burden in two ways:
- We break down large questionnaires into smaller ones, resulting in 6 daily surveys, containing 3–5 questions each, where each question is multiple choice and related to a single symptom. This way we cover a total of 20 major symptoms, and present them in a similar way to how a clinician would ask these questions in an in-clinic setting.
- We ensure previously entered information is readily available in the app, along with the time of the entry.
In designing the survey content, we collaborated closely with experienced clinicians and researchers to finalize the wording and layout. While studies in this field typically use the Likert scale to gather symptom information, we defined a more intuitive verbose scale to provide better experience for participants tracking their disease and the clinicians or researchers viewing the disease history. For example, in the case of vision issues, rather than asking participants to rate their symptoms on a scale from 1 to 10, we instead present a multiple choice question where we detail common vision problems that they may be experiencing.
This verbose scale helps patients track their symptoms more accurately by including context that helps them more clearly define their symptoms. This approach also allows researchers to answer questions that go beyond symptom correlation. For example, for vision issues, data collected using the verbose scale would reveal to researchers whether nystagmus is more prominent in patients with MS compared to double vision.
 |
| Side-by-side comparison with a Likert scale on the left, and a Verbose scale on the right. |
Focusing on accessibility
Mobile-based studies can often present additional challenges for participants with chronic conditions: the text can be hard to read, the color contrast could make it difficult to see certain bits of information, or it may be challenging to scroll through pages. This may result in participant drop off, which, in turn, could yield a biased dataset if the people who are experiencing more advanced forms of a disease are unable to provide data.
In order to prevent such issues, we include the following accessibility features:
- Throughout, we employ color blind accessible color schemes. This includes improving the contrast between crucial text and important additional information, which might otherwise be presented in a smaller font and a faded text color.
- We reduced the amount of movement required to access crucial controls by placing all buttons close to the bottom of the page and ensuring that pop-ups are controllable from the bottom part of the screen.
To test the accessibility of MS Signals, we collaborated with the National MS Society to recruit participants for a user experience study. For this, a call for participation was sent out by the Society to their members, and 9 respondents were asked to test out the various app flows. The majority indicated that they would like a better way than their current method to track their symptom data, that they considered MS Signals to be a unique and valuable tool that would enhance the accuracy of their symptom tracking, and that they would want to share the dashboard view with their healthcare providers.
Next steps
We want to encourage everyone to make use of the open source platform to start setting up and running their own studies. We are working on creating a set of standard study templates, which would incorporate what we learned from above, and we hope to release those soon. For any issues, comments or questions please check out our resource page.
Quick links
Other posts of interest
-
May 22, 2025
Google Research at Google I/O 2025- Climate & Sustainability ·
- Generative AI ·
- Health & Bioscience ·
- Quantum
-

May 7, 2025
A new light on neural connections- General Science ·
- Health & Bioscience
-
May 6, 2025
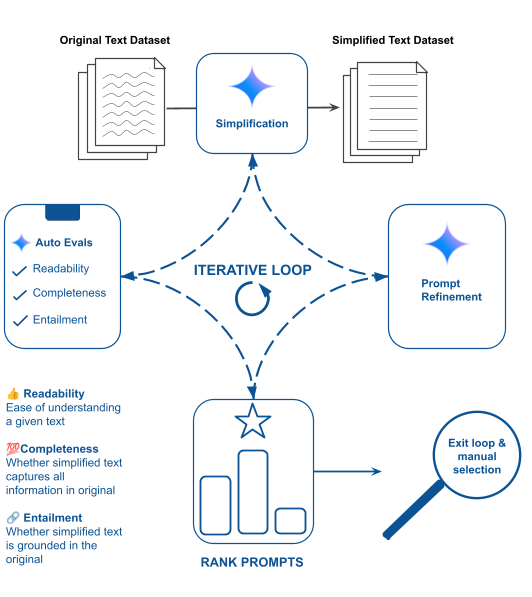
Making complex text understandable: Minimally-lossy text simplification with Gemini- Generative AI ·
- Health & Bioscience ·
- Product